Proqio – Redesigning the Setup Flow

Transforming a fragmented, multi-module technical setup into a cohesive, guided experience to reduce Time to Value (TTV) and support overhead.
Overview
Role: Product Lead & Senior Product Designer.
Timeline: 8 weeks
Team: Design, Frontend & Backend Engineering, CX.
Skills: Product Discovery, UX Strategy, Complex System Design, PLG (Product-Led Growth), Data Visualization.
Achievements
The implementation of this new flow radically transformed Proqio's technical onboarding.
Measurable Impact:
Drastic Drop in Abandonment: Users now complete the onboarding of their first instrument without cognitive friction.
Accelerated Time-to-Value: What previously took hours (and support calls) is now achieved in minutes using pre-configured integrations.
Support Scalability: The Customer Success team was able to stop acting as "system configurators" and refocus on providing strategic value to clients.
Reflection & Key Learning: As Product Lead, this project reinforced a vital software design lesson: Reverse Conway's Law applied to UI. The map is not the territory; the database structure should not dictate the interface's information architecture. Listening to field engineers and prioritizing "cognitive load" over "functional completeness" was the key to success. In complex B2B technical products, context is everything.
1. Business Context & Challenge
Proqio is a powerful platform for monitoring geotechnical sensors, among other things, but its initial power came with a steep learning curve. To configure sensors and start receiving data, users had to follow a highly fragmented process consisting of, at least, 5 strict steps:
Create Category (e.g., inclinometer, optical targets, crackmeters).
Import Instruments.
Configure Connectivity (FTP, MQTT, API).
Map Parsers.
Apply Calibrations (if applicable).
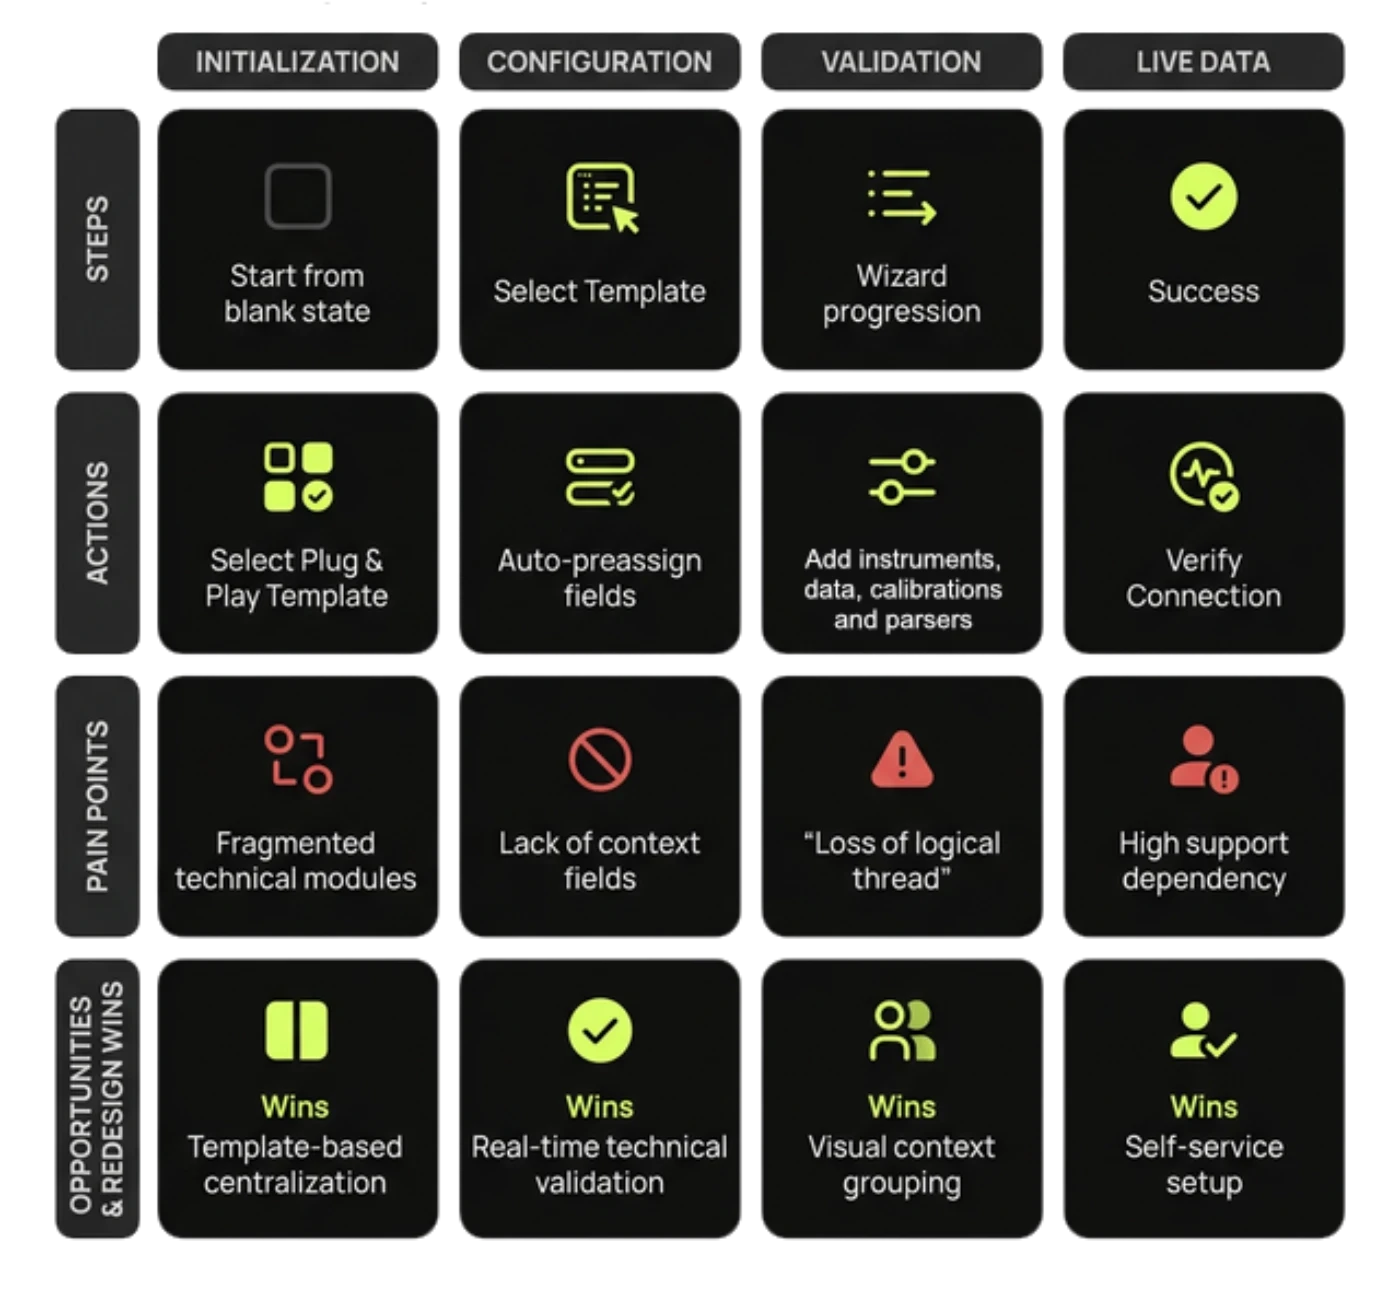
The Challenge: This flow made the process not only arduous but cognitively draining. Users quickly lost the "thread" of their progress. As a result, we faced high abandonment rates during initial setup and a critical dependency on the support team, who spent hours acting as a "white-glove" setup service just to help customers get started with the product they were already paying for.
The Mission: My goal as Product Lead was to orchestrate a complete redesign of this flow, focusing on reducing cognitive load and accelerating Time-to-Value, without sacrificing the technical robustness and flexibility required for the platform to operate.
2. Discovery & Research
To understand where the flow was breaking, we launched a qualitative research phase, interviewing the platform's primary users and gathering insights from CX team.
Initially, from a product perspective, we assumed the problem was the technical complexity of each module (FTP, data parsing, etc.). However, we discovered the real blocker wasn't technical, but a lack of context and system visibility. One user gave us the exact key to the problem:
"I don't know if the parser I'm creating now will work with the category I created 10 minutes ago."
Key Insight: Users don't think in terms of "database modules" or "software architecture"; users think: "I want my sensor working." They needed a holistic experience, not a series of disconnected and abstract administrative tasks. But overall, they need a "plug and play" that allow them turn the system on as soon as possible with no frictions.
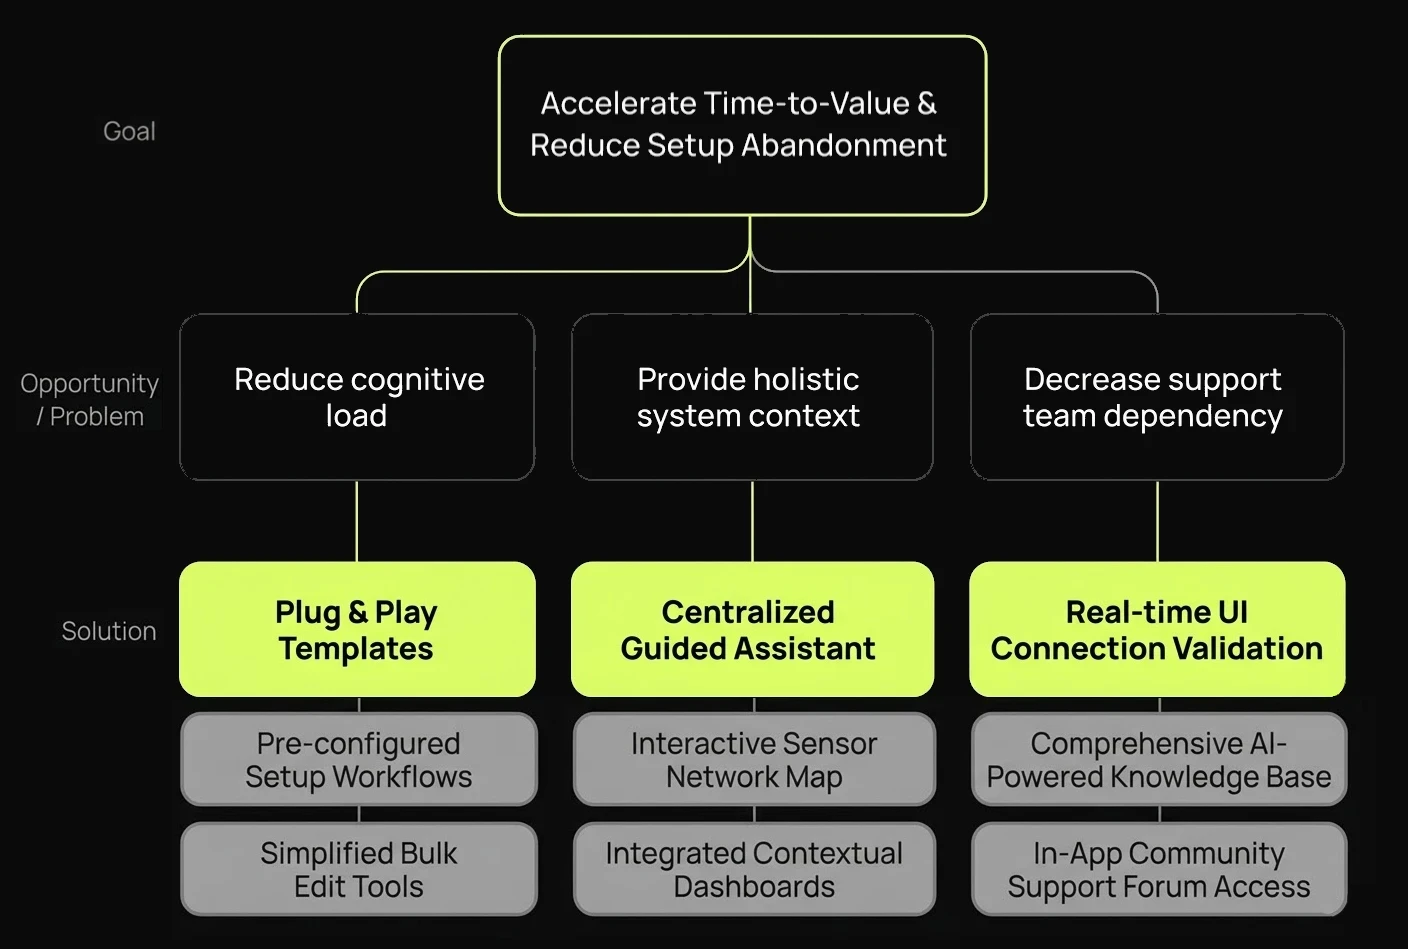
Opportunity Solution Tree
User Journey Map
3. Product & Design Strategy
Based on our primary insight, the strategy pivoted radically: we had to stop showing the user how our database was built internally and start speaking their language.
From "Modules" to "Templates": Instead of forcing users to create categories, parsers, and connections from scratch, we introduced predefined templates and "Plug & Play" integrations for the most common commercial sensors in the market.
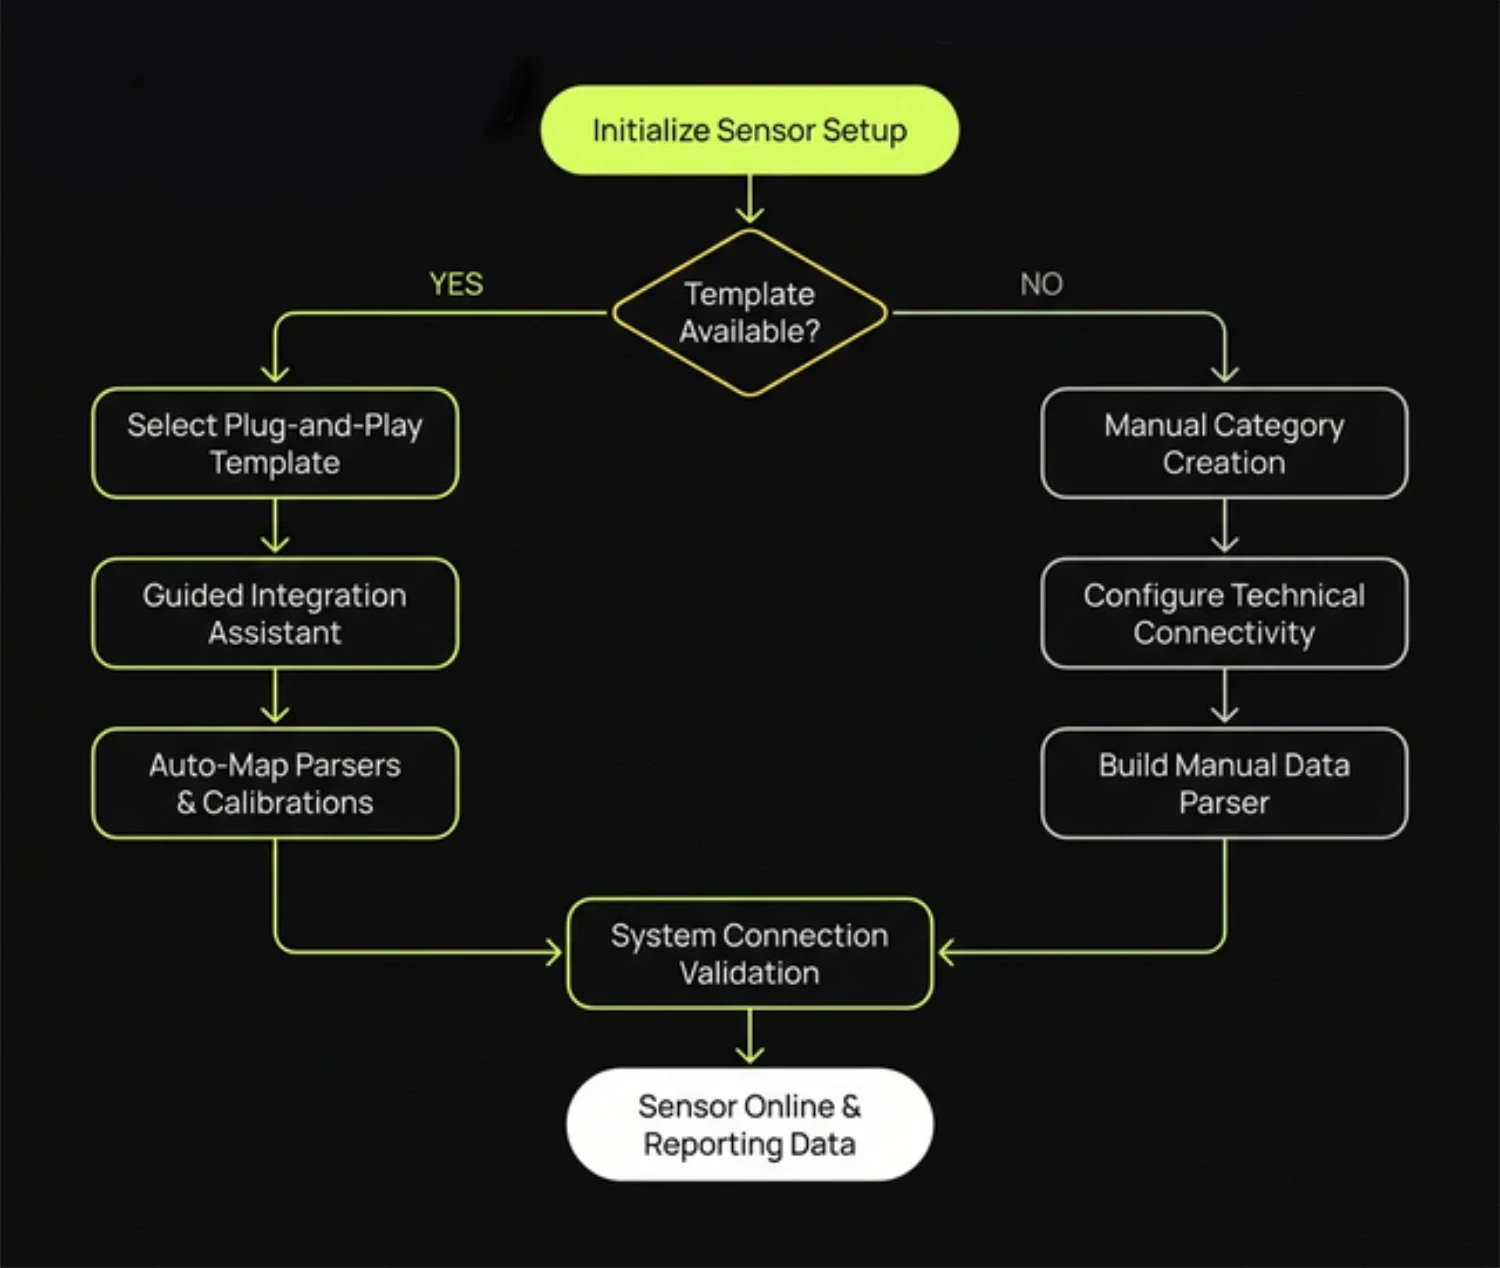
Centralizing Context: My team designed a new flow where the user never loses sight of the end goal. We grouped category creation (from template or scratch, instrument creation, connectivity, and parsing into a single guided assistant, keeping the "logical thread" visible at all times.
Strategic Decisions & Trade-offs: We decided to sacrifice initial "absolute flexibility" (where users could create a 100% custom parser from a blank screen) to guide them through a structured flow. We resolved 80% of common use cases with two clicks via templates, relegating advanced manual configurations to the background (progressive disclosure).
4. Execution & Development
Designing the solution required close technical collaboration, as we needed to abstract backend complexity and present it simply in the frontend.
UI Architecture: I utilized the Design System to create clean cards, clear selection states, and a step-by-step progress system. We transformed dry forms into a visual "Integration Selection" experience.
Immediate Feedback: One of the users' biggest fears was "breaking something." We implemented real-time validations and clear status indicators during MQTT or FTP connections, ensuring users immediately knew if the data channel was live.
Next steps: include within the flow the possibility to integrate and connect data via API with some most common providers.
Visual Flow Evolution:
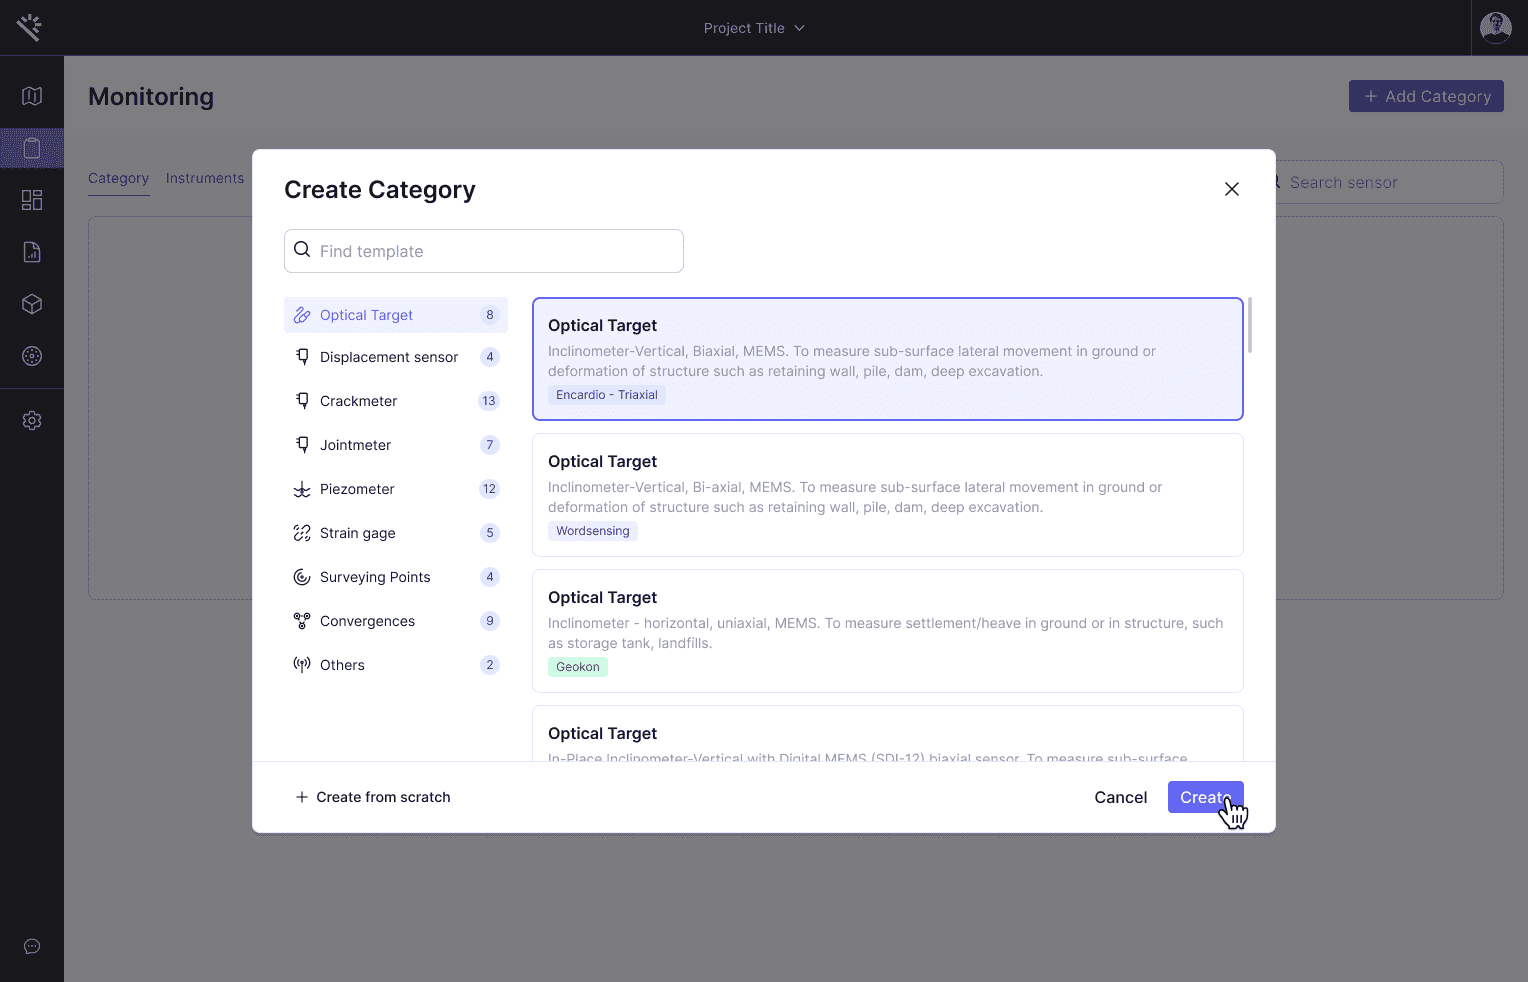
Step 1: Visual selection of an Integration/Template instead of starting from a blank "Category" creation.
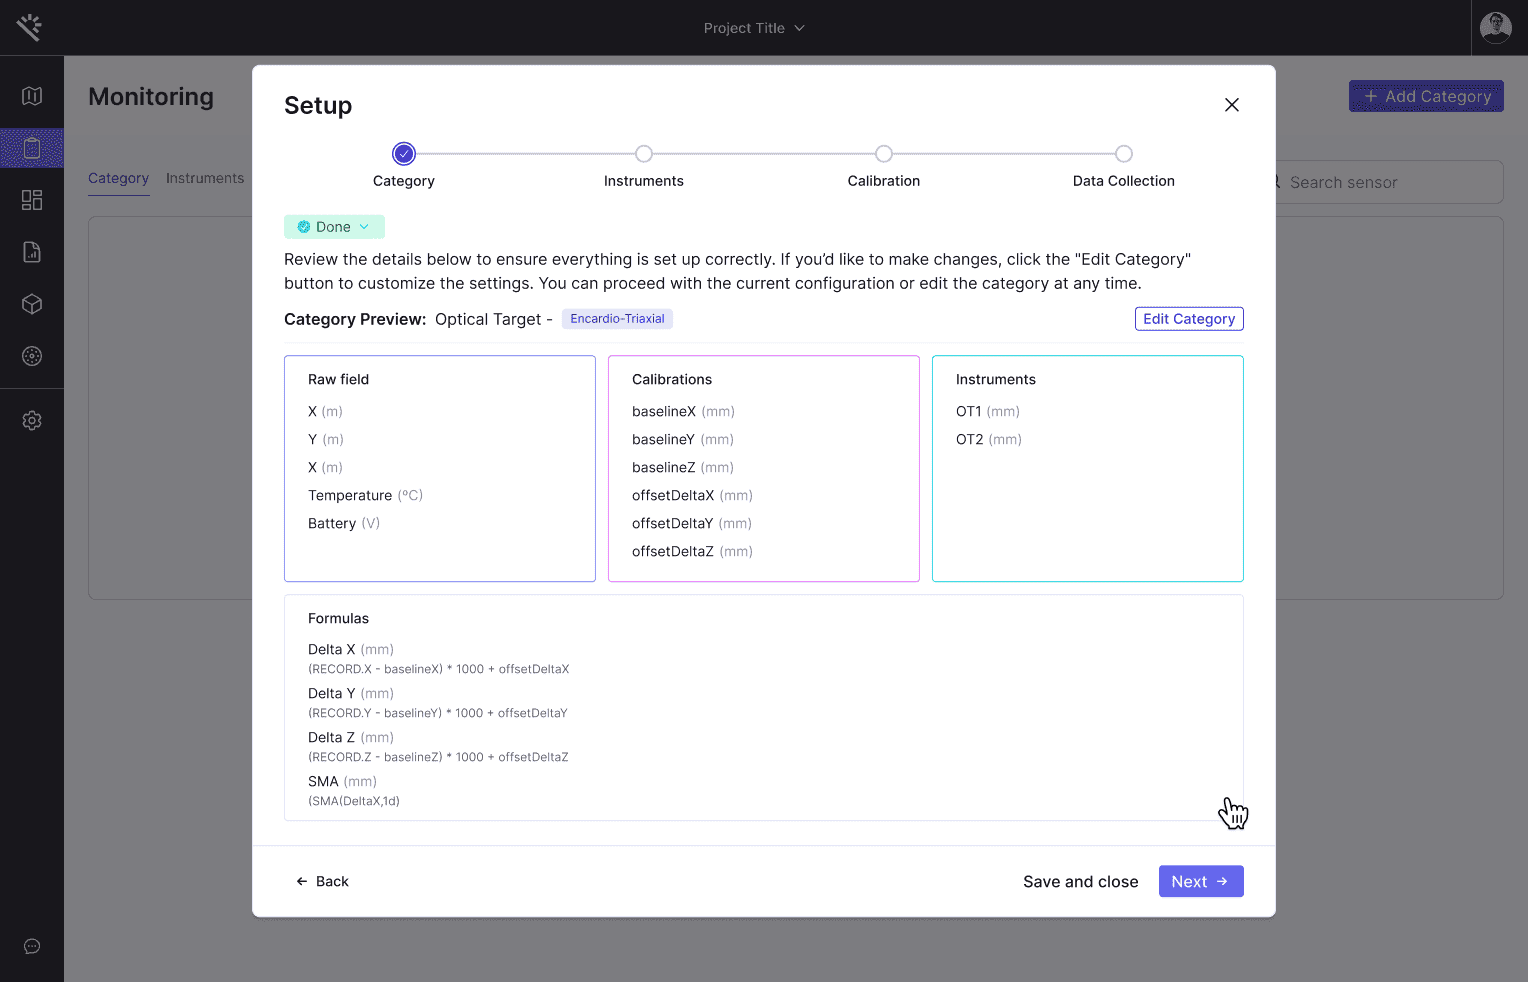
Step 2: Reviewing the metadata and fields automatically pre-configured by the template.
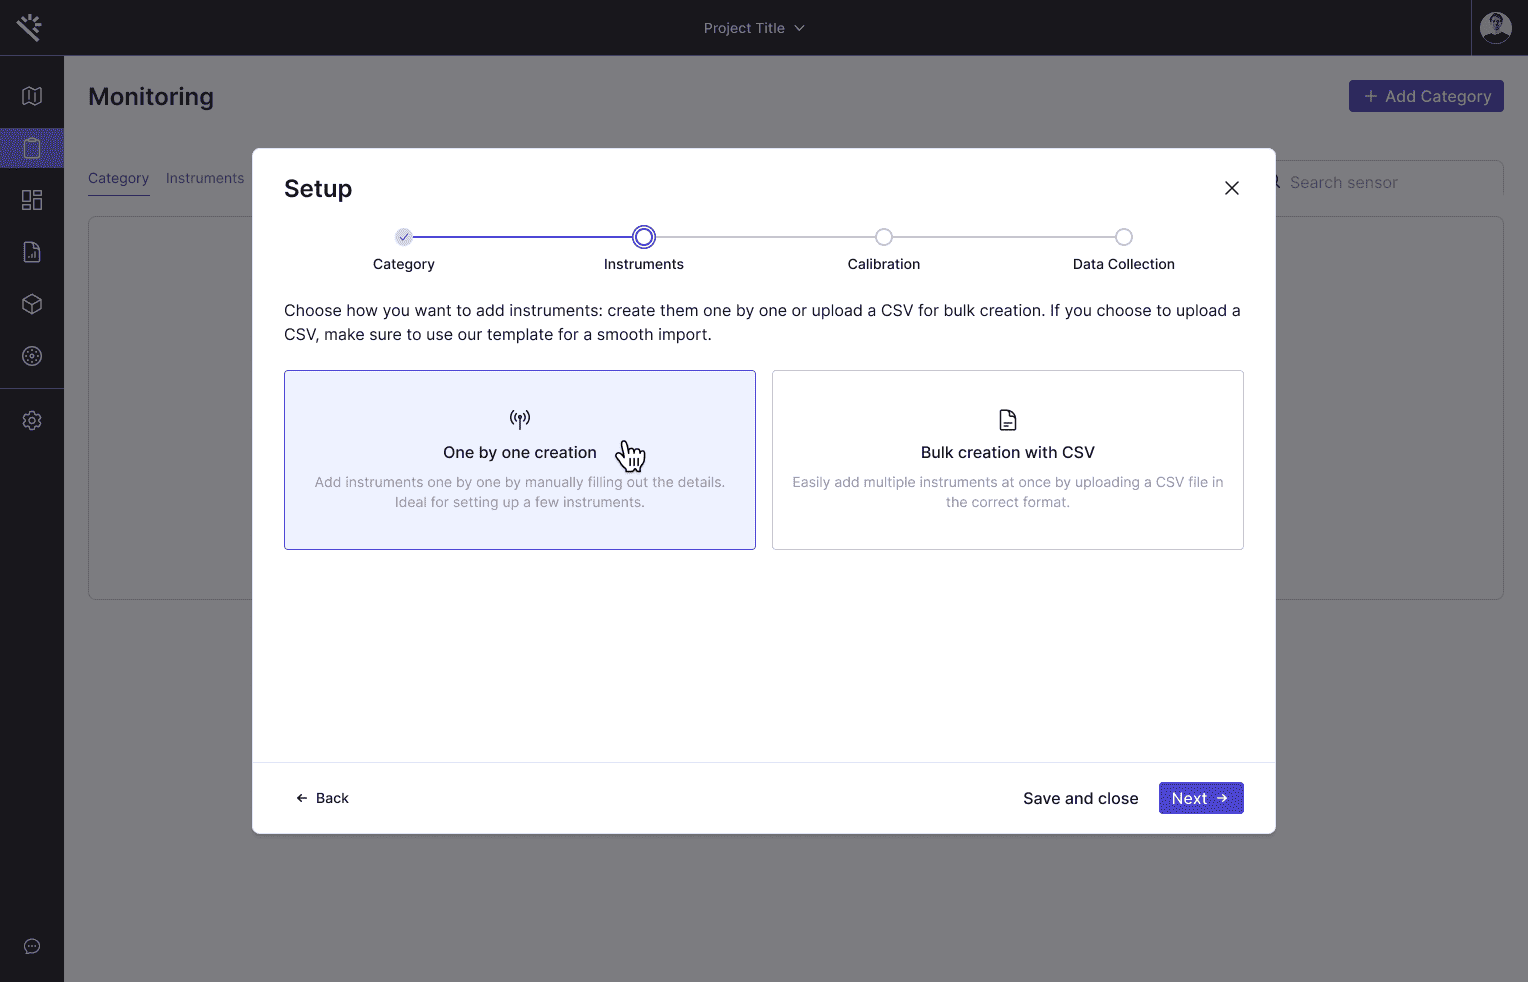
Step 3: Adding specific instruments/sensors to the newly created category.
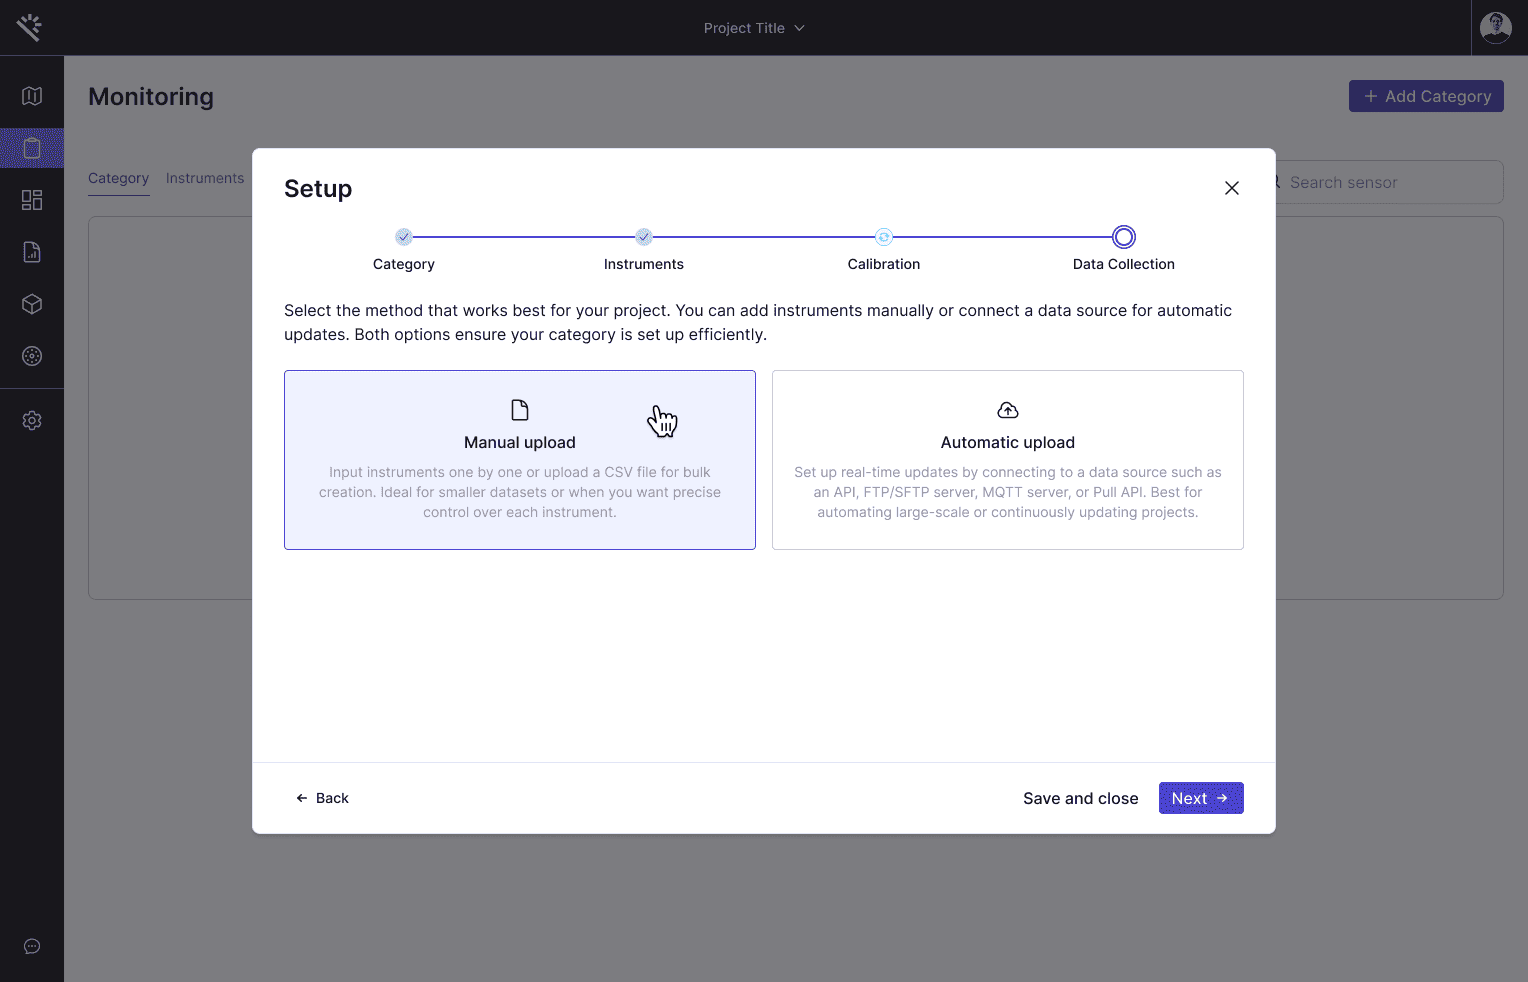
Step 4: Initiating the connectivity setup to start receiving real-time data or historical logs.
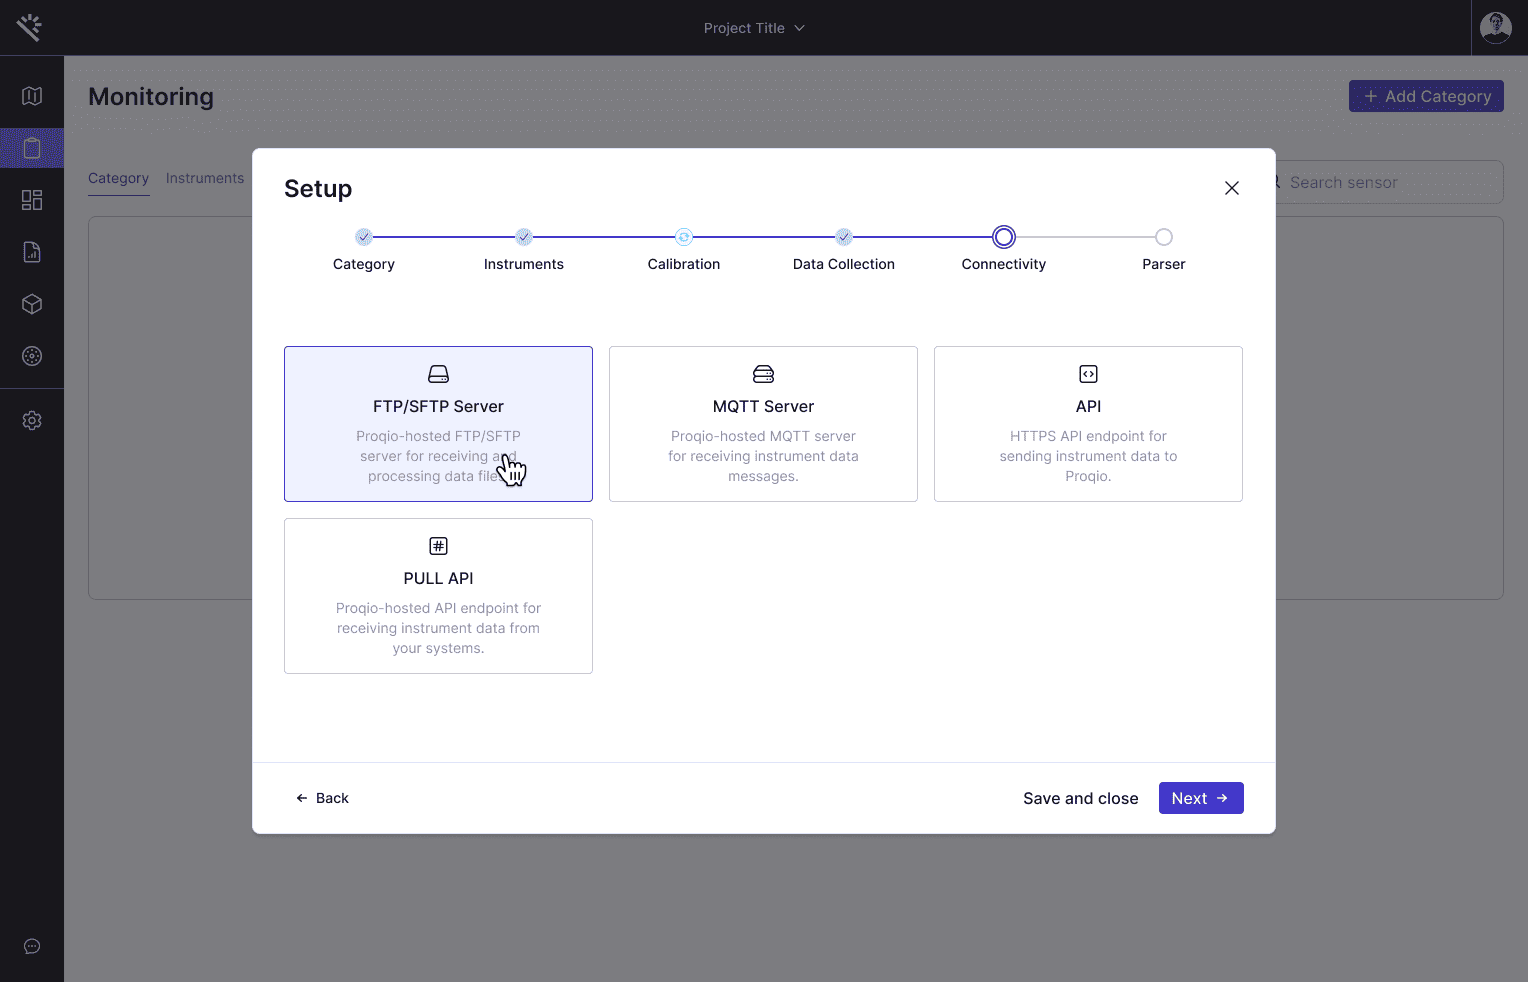
Step 5: Selecting the connection protocol (FTP, MQTT, API) appropriate for the hardware setup.
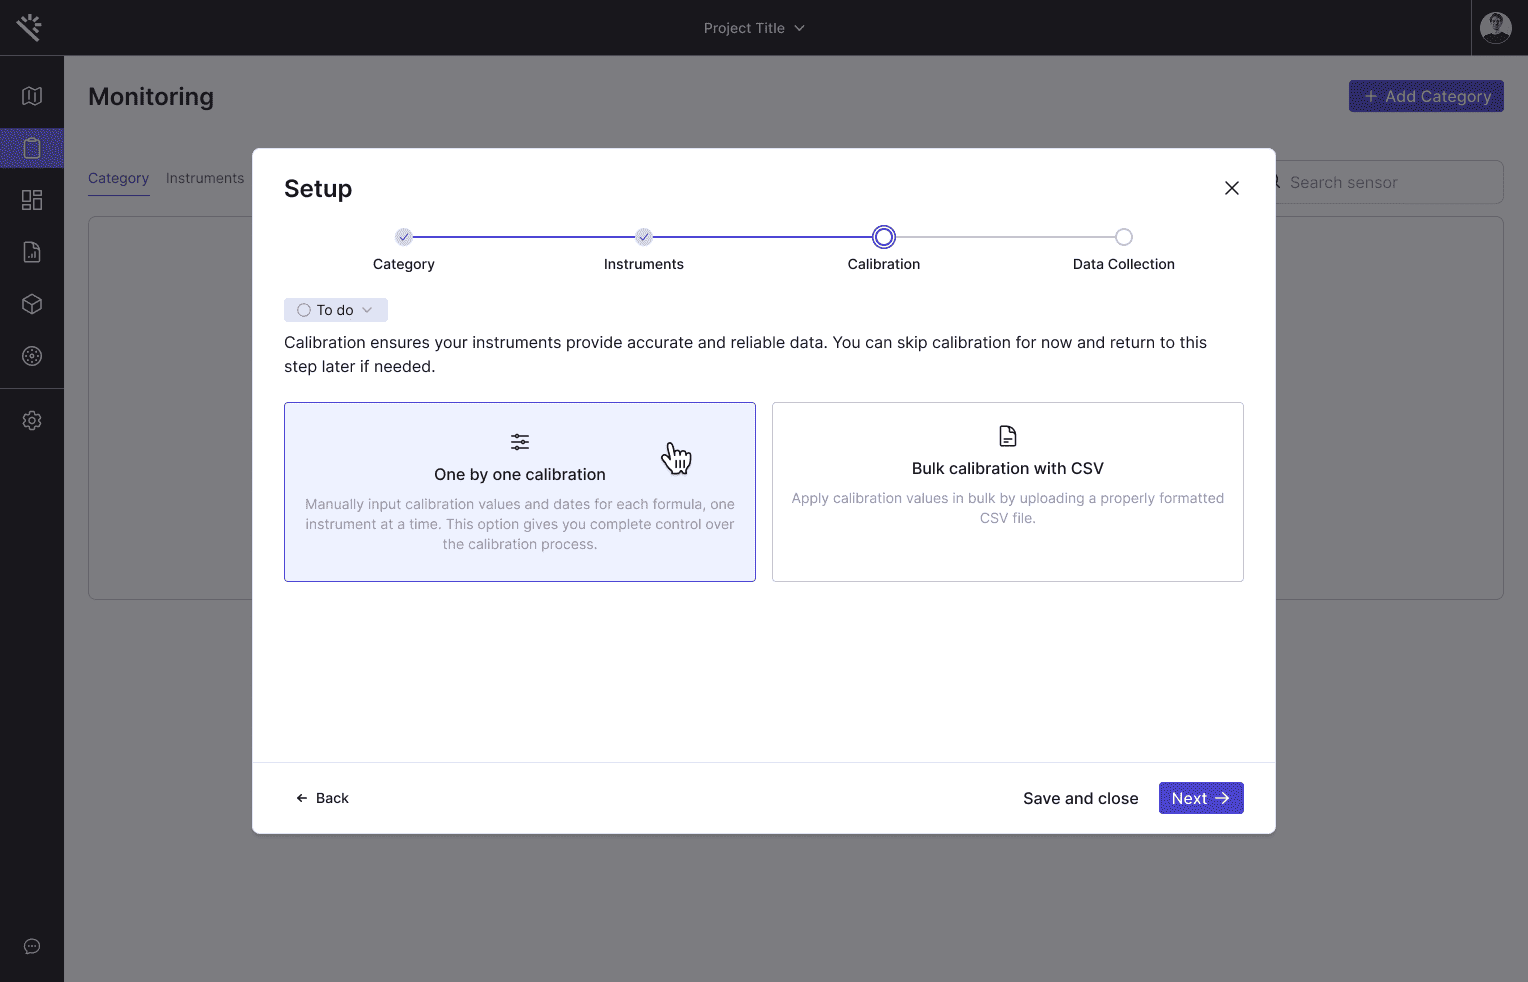
Step 6: Applying mathematical calibrations to transform raw data into precise engineering units.

Step 7: Mapping the raw data stream to platform variables via an intuitive parsing interface.
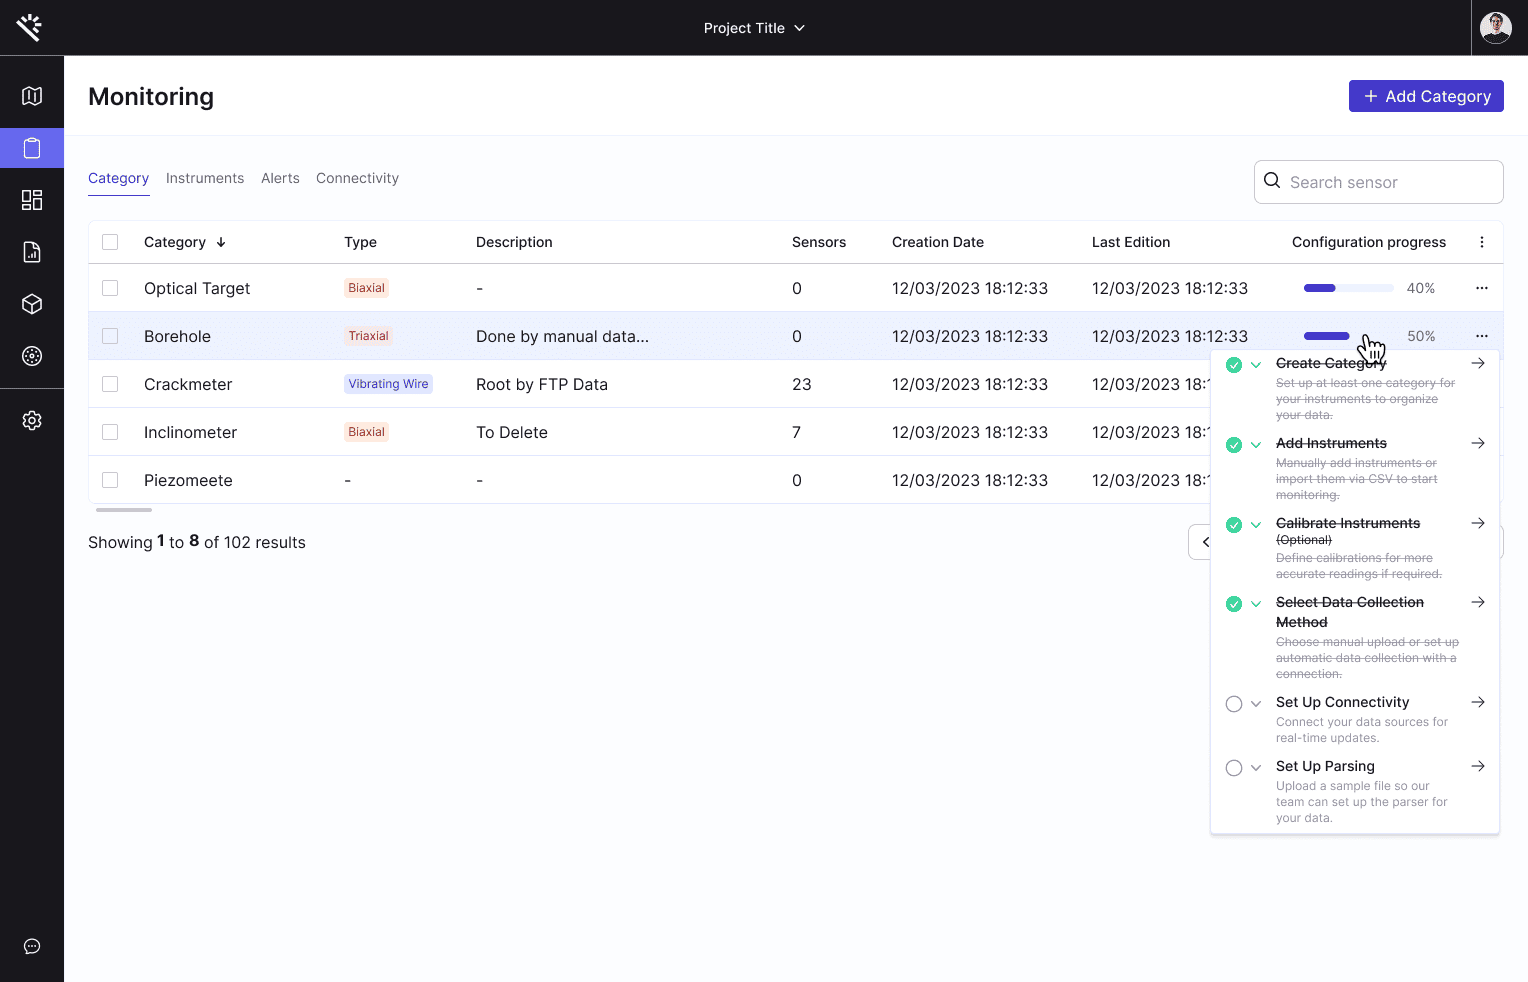
Step 8: Final overview of the setup progress, ensuring system visibility and context for the user.